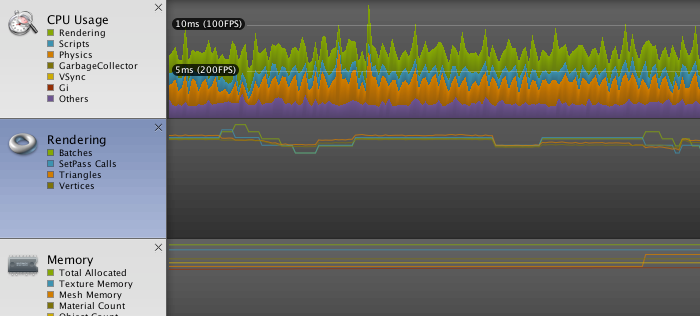
Screenshots after optimization
-
by Christian Engvall
- March 8, 2016
- 0
Please share this post with your friends


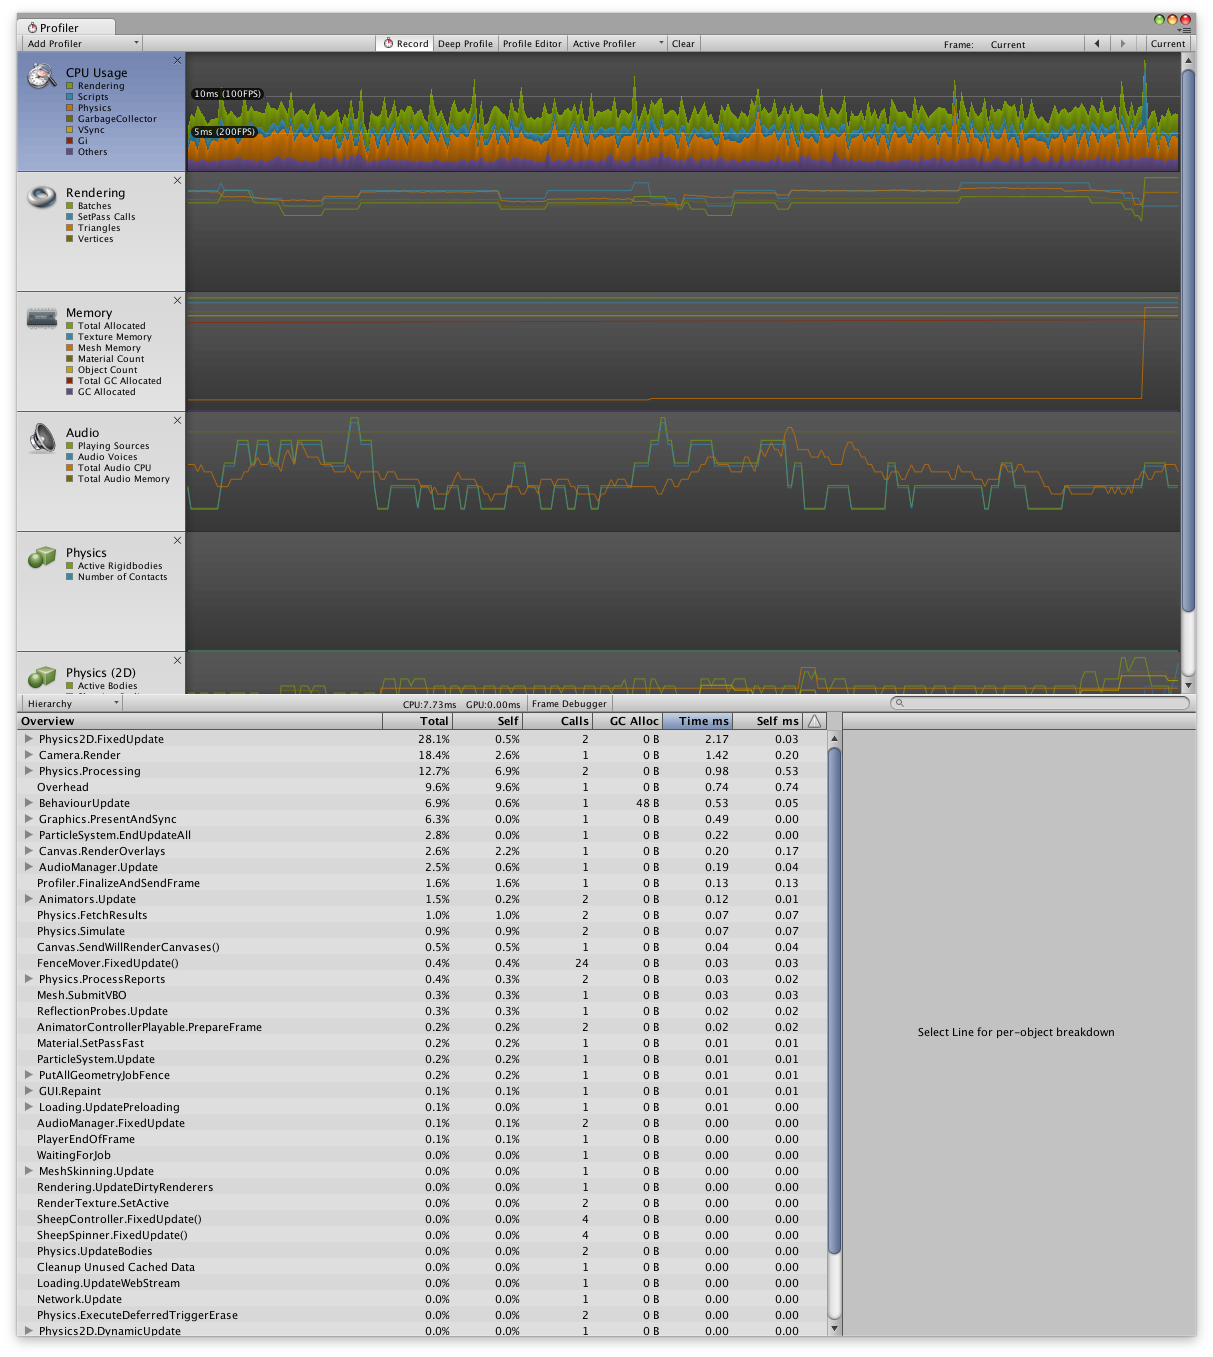
I got a question from Valentin Simonov after the last post how much performance there was to gain on those game optimizations. I actually took some screenshots on the profiler after a few of the steps in that post, however not all of them. But I thought I’d share those I captured.
All profiling was done when the game was running on an iPhone 5. The game was played until I reached the same score on each profiling-round. The optimization that did most of the difference was changing to simpler colliders. Separating game objects into physics layers gave the second best result.
This was what the profiler looked when the game was unoptimized:
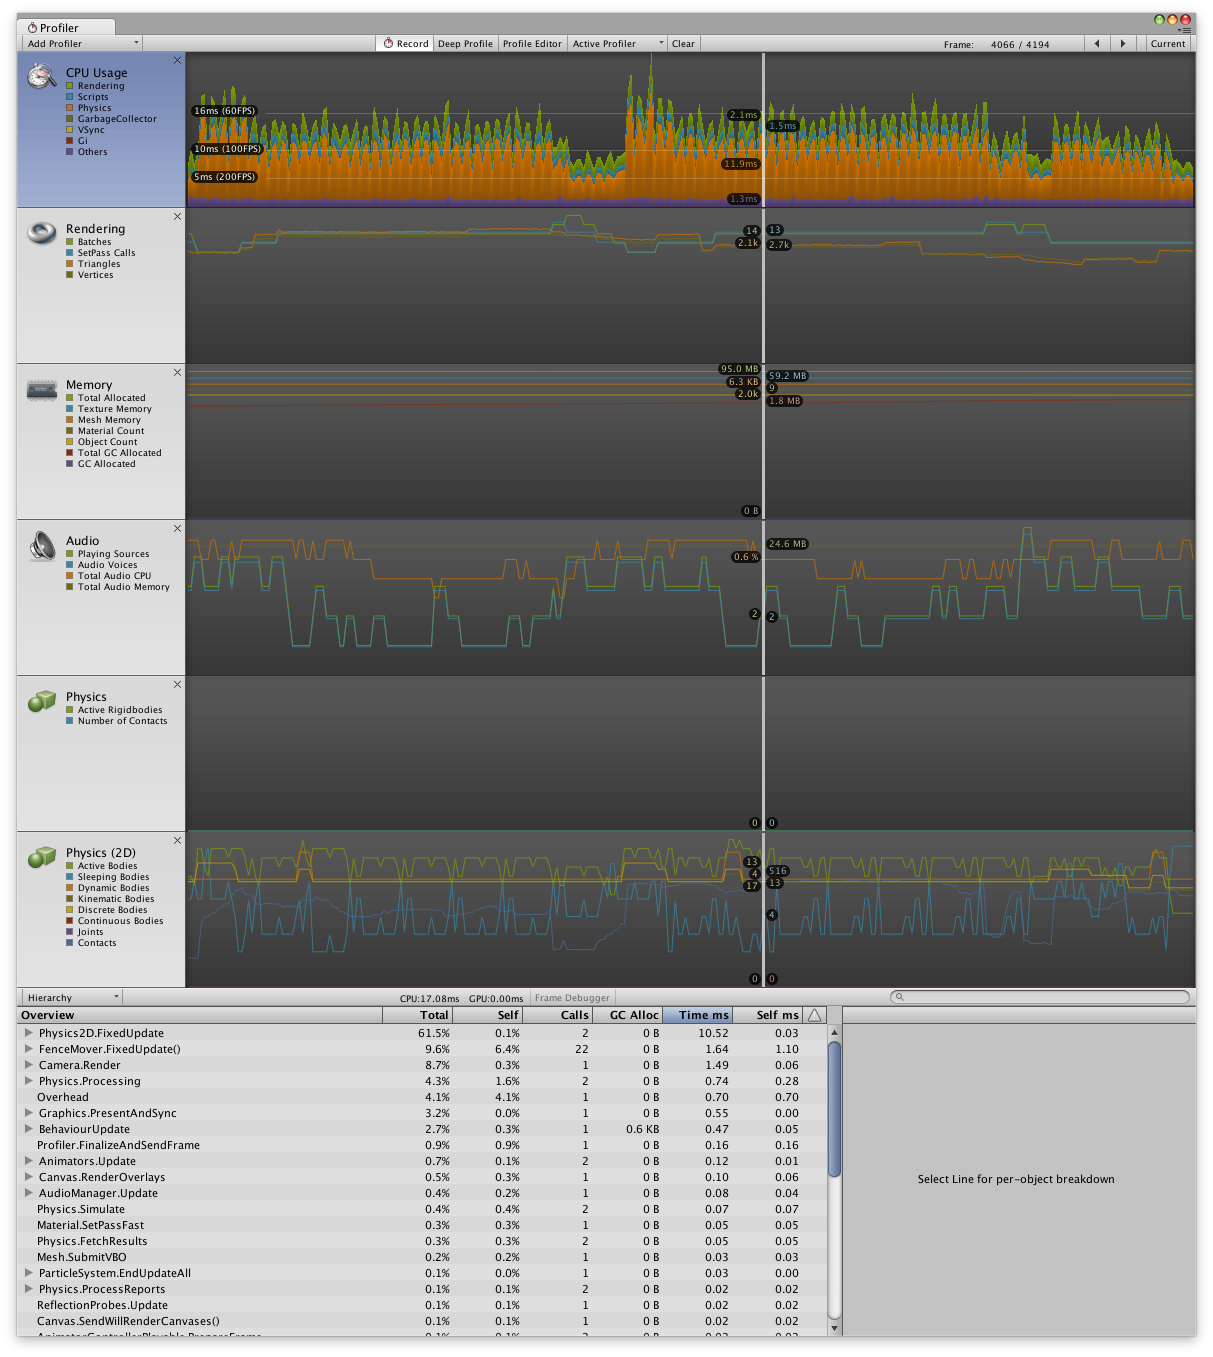
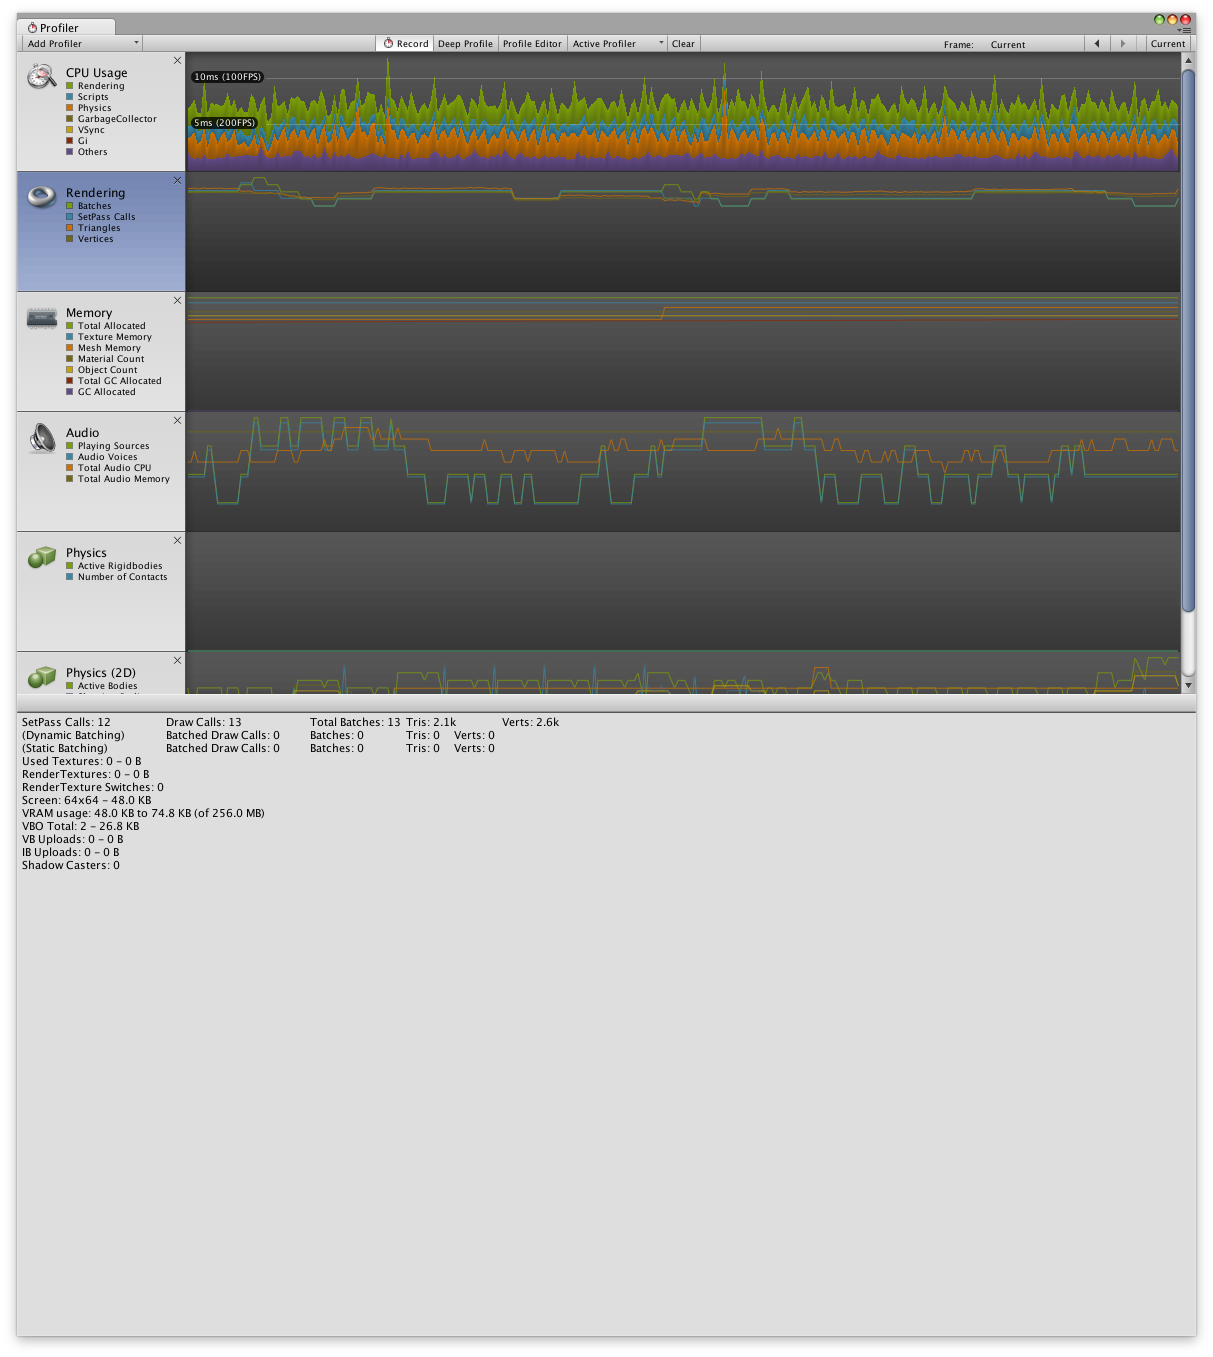
This is what the profiler looked after each game object was added to a physics layer:
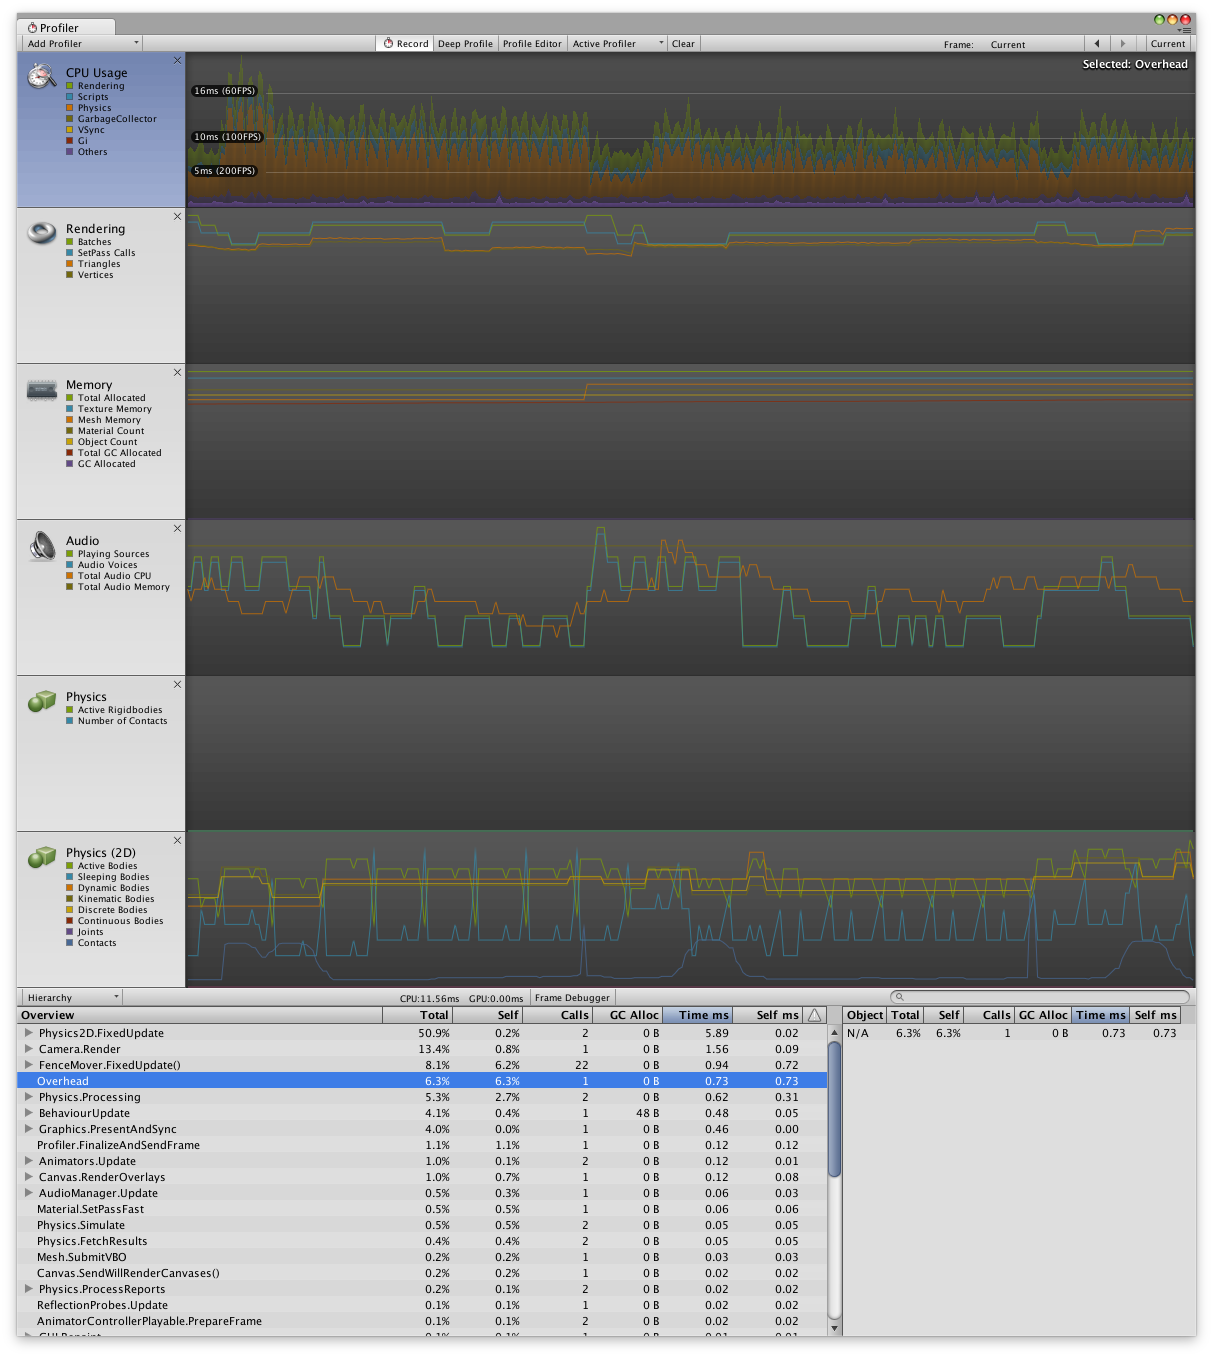
This is what the profiler looked after the component lookups was cached:
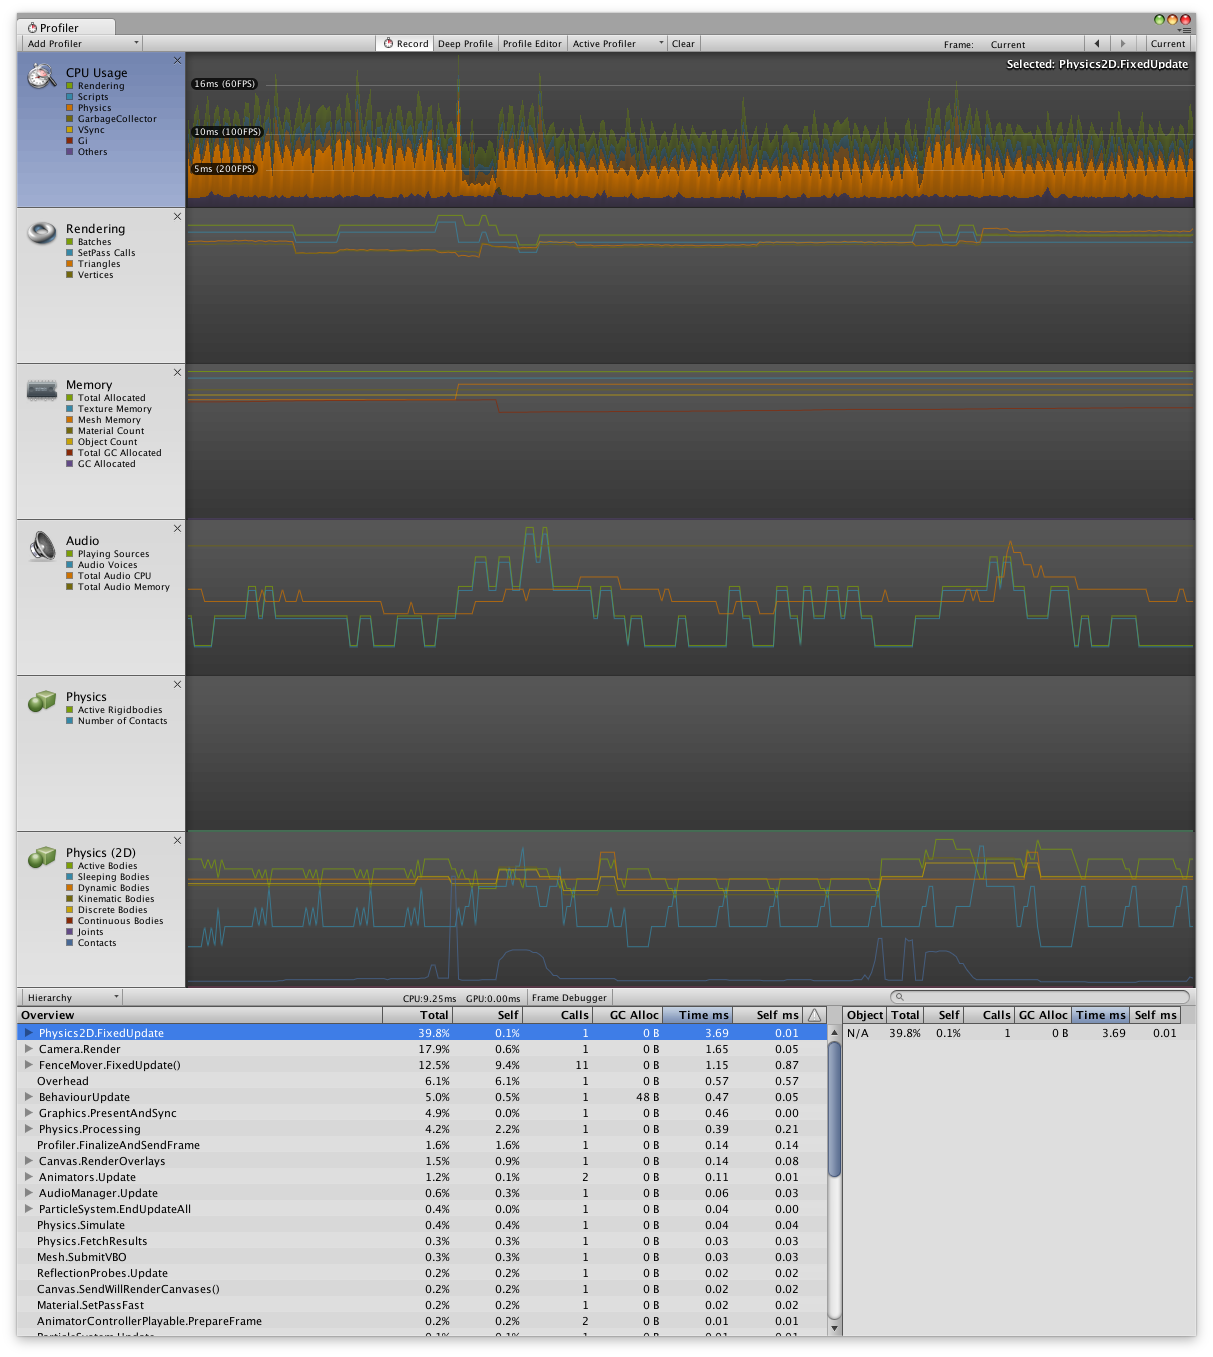
These two screenshots come from changing from polygon2D colliders to the simpler box2d colliders:
Changed more objects that didn’t need a polygon2dcollider to box2dcollider:
Categories: Game development